Things to know for GA & Adwords implementation

Tuesday, June 30, 2009 | Published in | 1 comments

First things first, you must make sure these two steps are completed within your Adwords Account.

1. URL auto tagging - enable it in My account -> Account Preferences


2. Analytics tab ->Analytics Settings ->Profile Settings -> Edit Profile information, and tick off "Apply cost data" radio button.

Remember to save your changes!

You need to also remember the following

1. Adwords cost data is applied to all profiles in an account. So if you want to track multiple domains your best bet is to start a new GA account for each domain.

2. Testing after enabling auto-tagging -
On enabling auto tagging your adwords URL's will look like this

www.website.com/?gclid=XXXXYYYY


If you use a third party ad tracking system like Doubleclick DART, Atlas etc these may add another tracking parameter to the existing URL thereby stripping it of its Adwords tracking.

Remember: When there is more than one question mark "?" in a URL, all the code that comes in after the second "?" will be stripped off, and therefore your tracking will be incorrect.

Now, here is what you can do:

1. Replace the second "?" with a "#" so the URL can be processed correctly. You can request a client rep at your third party ad tracker to set this up for you.

2. You can alter your destination URL to not include the first "?", instead you can use any other variable
Ex: www.website.com/%3F=dum=1
Adwords will now append the gclid as

www.website.com/%3F=dum=1&gclid=XXXXYYYY

The 3rd party ad tracker will look like:

http://www.thridpartyadnetwork.com?www.website.com/%3F=dum=1&gclid=XXXXYYYY


Thanks and leave me a comment!
GA code for keeping a copy of your data beyond 25 months

| Published in | 0 comments

I have added an extra space in the < script > tags at the start and the end.

I have set pageTracker in BOLD to include your remote server.

< script type="text/javascript" >
var gaJsHost = (("https:" ==

document.location.protocol) ? "https://ssl." :

"http://www.");
document.write(unescape("%3Cscript src='" + gaJsHost

+ "google-analytics.com/ga.js'

type='text/javascript'%3E%3C/script%3E"));
< / script >
< script type="text/javascript" >
var pageTracker =_gat._getTracker("UA-xxxxxx-2")
pageTracker._setLocalRemoteServerMode();
pageTracker._initData();
pageTracker._trackPageview();
< /script >

Thanks! and do leave me a comment if you found this useful!

Why I love Tableau?

Monday, June 22, 2009 | Published in | 0 comments

What is Tableau?

Tableau is a Business Intelligence tool for the "analyst folk".

Tableau is fighting hard to win some market share in the big bad BI world with mammoths like IBM Cognos, Oracle, SAP BO and the rest of the biggies who have their tentacles entrenched in most corporations.

I am not one to evaluate how their back-end works or how fast or optimized they are. But their User Interface is one that rocks! It's the most intuitive, easy, and flexible user interface I have ever used.


Other than the fact that the world loves an underdog, here are some amazing reasons to love Tableau.

1. They removed that big brick wall called IT.

You can get access to your data, anytime, define it the way you want it.

2. Segmenting data in Tableau is easier than changing up a pivot table in Excel.

3. Tableau makes you think of segments you would've never thought of on your own.

The drag drop makes this feature even better!

4. Their data comparison views make you feel like you are using the Mac after years of using the PC.

5. Tableau does everything any other BI tool would do export data, schedule reports etc except for once it puts the data in the hands of those who struggle to get to it.

Clearly, I love Tableau!

My only caveat is one that holds true for any new technology.

Technology will give you data, but will never give you answers

If you have never used Tableau, and want to know what the ho-haw is about - Download their free trial here!
If you have used Tableau, let me know what you thought of it in the comments section!

Disclaimer: This is not an endorsement, I dont work for Tableau nor am I making any money off of this post.


Thanks!

Statistics & Web analytics

| Published in | 0 comments

There are so many questions plaguing analysts, one of the biggest ones is:

Which statistical test do I use?


Disclaimer: The content of this post has been well researched, but if you do find errors big or small, please leave a comment, and we can discuss the point of contention.

Now, back to statistics. The #1 reason analysts use statistics is to test for significance i.e is my answer/data statistically significant?

What you need to do
1. Formulate a hypothesis - Are my CTR's statistically significant?
2.

Having researched this over and over to find the right tests - these are my conclusions.

There are 3 tests as they relate to A/B testing

1. Z test
2. Chi square test
3. Fishers Exact Test

Multivariate Testing
1. Full factorial tests/Taguchi method - reduces the sample size required to get to an answer.

2.

Both omniture SiteCatalyst, Google Website Optimizer use full/fractional factorial tests for MV testing.

For A/B testing however, Google does not mention how or what statistical tests they use to discern a winner.

Google Analytics by the Hour

| Published in | 0 comments

Can I track website stats every hour?

Yes! Google Analytics can do that!


On the top right of your dashboard are your graph options - the first of which is by hour.

Below, the chart option is set to show data by the hour.


The default data is shown "by Day", you can chose to view your data by hour, day, week or month!

It really is as easy as that.

After you find the data you want

1. Export to Excel - Below the orange navigation bar on GA is the "Export" Tab


On clicking the file format of your choice - the save as window pops up.


2. Add to Dashboard - If you think this is an important metric, and you want to track it for the next couple of months all you need is to click on the "Add to Dashboard" button on the very top of your page, below the orange bar.


That report then becomes part of the dashboard you see as soon as you login!

Hope you had a fabulous time with GA!

Thanks!

Set up News Feeds by Keyword

| Published in | 0 comments

When working as a research analyst in a financial consulting firm in Washington DC, I remember thinking why do I have to receive all these newsletters everyday? Because after a while you get "news hypnosis" where all you are doing is skimming the headlines. Despite doing this often times I found myself missing out on news that was valuable, and having someone tell you whats going on is a HUGE faux pas.

You are expected to be wired into everything at the same time. For terrible multi-taskers like me. There is a way out.

A combination of Google Alerts plus Google Reader can get you the most targeted news you want.

This does not work for newsletters per-se but it does inform you of any news by entering a keyword of your choice, ideally something specific to your industry.

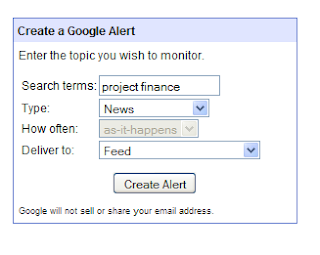
Here are your step by step instructions

1. Go to http://www.google.com/alerts


2. Select the keyword of your choice.

3. Enter what kind/source of information you want your news from


5. Set up how often you want the above to update and either

6. Have it sent to your email or set up a feed.


I recommend setting up a feed. We all get more emails than we can handle, dont we?

Once you chose set up a feed, the how often tab defaults to as-it-happens.

7.Hit "Create Alert"

You will see this:


8. Now click "Add to Google Reader" and you will see this:
                                                                                                                                                                  

9. Now you are all set to be updated on any news on the web related to the keyword "project finance" delivered right to your reader.
Hang in there, it takes a while. Give it atleast 24 hours to give you any updates.

10. The next time you want to view the updates. Go to reader.google.com

Log-in and you should be able to see any new updates you have!

Good luck.

P.S: This is a cheap way to keep tab of your identity and rumors about you (or your celebrity alter ego) on the web :)

What a Web/Data Analyst needs to know about Log Files

| Published in | 0 comments

As a non-technical web analyst, this is what I think a web analyst should know about log-files.

Log files are text documents that track every request for information from the server. Think of it as a server side record of all the website clicks/requests made by the user.


For someone who has never seen it - THIS is what a log file looks like and they are HUGE. Especially since every single click/interaction is recorded there are millions and millions of records for a fairly popular website.


What you want to do with this information?
You need to get the information in the log files into a table format with only the segment of information you need.

What you will need
1. A free SQL tool - The most popular of which is Toad, download here
2. Login information to the database/datawarehouse that hosts the log files. Your company should be able to provide you with that information.
3. Basic knowledge of SQL, which can be learnt here at the W3 school.

If you don't have time to learn SQL queries. If you want a quick fix, or a data dump. Try this, though I should warn you it is not recommended.

Select * from tablename

and export the whole table into Excel or any other format you require. This is the easiest way to get a dump of data, from which you analysts can find your way (i hope!)

Click here for more of a technical know how into when and how to use log file analysis